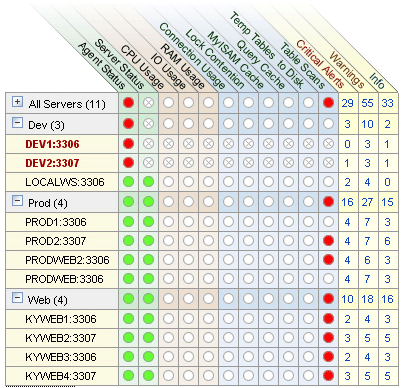
The Heat Chart is found on the right side of
the Monitor page and shows the status of
critical rules. Monitored servers are organized by groups. To view
the status of a specific server, click the
button next to the appropriate server
group.
Whenever a new agent contacts the Service Manager for the first time, all the rules in the Heat Chart Advisor are automatically activated. These Advisors monitor the status of the server and agent, critical operating system indicators, and important events related to your MySQL servers. An example follows.
To interpret the Heat Chart see the following legend.
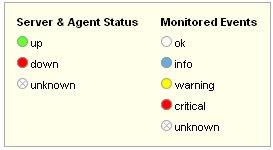
The status unknown will typically apply when an
agent is down and can no longer report the status of the server
that it is monitoring. The status unknown may
also apply if the data collection that should be collected is not
available on the server being monitored.
You may open the Heat Chart in its own browser window by clicking
the Standalone Heat Chart link immediately
below the Heat Chart on the left. If you like,
the refresh rate can be set to a different rate than the setting
on the Monitor page.
In addition to showing the most important advisors, the
Heat Chart also has columns that display the
number of critical, warning, and informational alarms. Clicking
the hyperlink in any one of these columns takes you to the
Event screen, which gives more detailed
information. For more information about events see,
Section 15.8, “The Events Page”.
When the Dashboard is first installed no notification groups are associated with the Advisors shown in the Heat Chart. For more information on this topic see, Section 15.3.2.7.3, “Installing Advisors After Initial Log-in” and, Section 15.5.5, “Manage Notification Groups”.
User Comments
Add your own comment.