To create an EER diagram for the sakila
database, first add an EER diagram by double clicking the
Add Diagram icon in the EER
Diagrams panel. This should create and open a new
EER Diagram.
The EER Diagram canvas is where object
modeling takes place. To add a table to the canvas, select the
Catalog tab in the middle panel on the
right side of the application. This should display any schemata
that appear in the MySQL Model tab.
Find the sakila schema and expand the view of its objects by clicking the button to the left of the schema name. Expand the tables list in the same way.
You can add tables to the EER canvas by picking them up from the
Catalog panel and placing them on the
canvas. Drop the address table and the
city table onto the canvas.
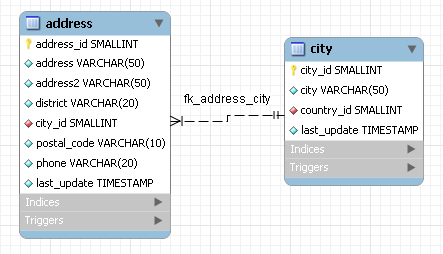
MySQL Workbench automatically discovers that
address.city_id has been defined as a foreign
key referencing the city.city_id field. Drop
the country table onto the canvas and
immediately you should see the relationship between the
country table and the city
table. ( See Figure 7.45, “The sakila EER Diagram” to view a PNG
file of all the relationships in the sakila
database.)
Choose the Properties tab of the panel on the
lower right and then click one of the tables on the canvas. This
displays the properties of the table in the
Properties window. While a table is selected
you can use the Properties window to change a
table's properties. For example, entering
#FF0000 for the color value will change the
color accent to red.
Changing the color of a table is a good way to identify a table
quickly — something that becomes more important as the
number of tables increases. Changing the color of a table is
also an easy way to identify a table in the Model
Navigator panel. This panel, the uppermost panel on
the left side of the screen, gives a bird's eye view of the
entire EER canvas.
Save your changes to a MySQL Workbench Models
file (mwb) by choosing from the
menu or by using the keyboard command
Ctrl S.